The Reliability-Cost Inversion Law: Why Reliability Gets Cheaper at Scale
///////////////////////////////////////
Featured in SRE Weekly 507 https://sreweekly.com/sre-weekly-issue-507
///////////////////////////////////////
Want to try it out? Take the 5-minute Reliability U-Curve Assessment → reliabilityeconomics.com/benchmark
///////////////////////////////////////
I realized something uncomfortable about how most companies fund tech operations: they treat the spend as one-sided, lumping everything into a single budget.
We celebrate incident response, major incidents, “great problem management,” and heroic recovery, year after year. But we rarely treat reliability like an economic portfolio with two buckets that must be managed together:
Failure spend (reactive): incidents, recovery, hotfixes, war rooms
Prevention spend (proactive): automation, SLOs, resilience patterns, chaos testing, observability, toil reduction
Once you force both sides onto the same page, the conclusion is transformative:
Prevention and failure costs are linked.
More prevention (done well) reduces failure cost, not just downtime, but the total firefighting drag.Balancing both reduces total cost.
There is an “optimum” point where the sum of prevention + failure is lowest.Transparency changes decisions fast.
When leaders see failure and prevention as comparable line items, most realize they are over-investing in failure remediation.Failure costs are massively underestimated.
The real bill includes war-room coordination, context switching, delayed releases, brand damage, negative reviews, increased support load, and the cultural tax of constant firefighting.At scale, reliability becomes cheaper — not more expensive.
Past a certain threshold, prevention compounds (automation, standards, paved roads), while failure costs multiply with system complexity.
With that framing, let’s unpack the mechanics behind the U-curve — and how to find the bottom of it.
At scale, reliability is not an engineering “nice to have.” It’s an economic strategy. There’s a point where every additional dollar invested in reliability reduces total cost, even if achieving the next “nine” looks expensive at first glance.
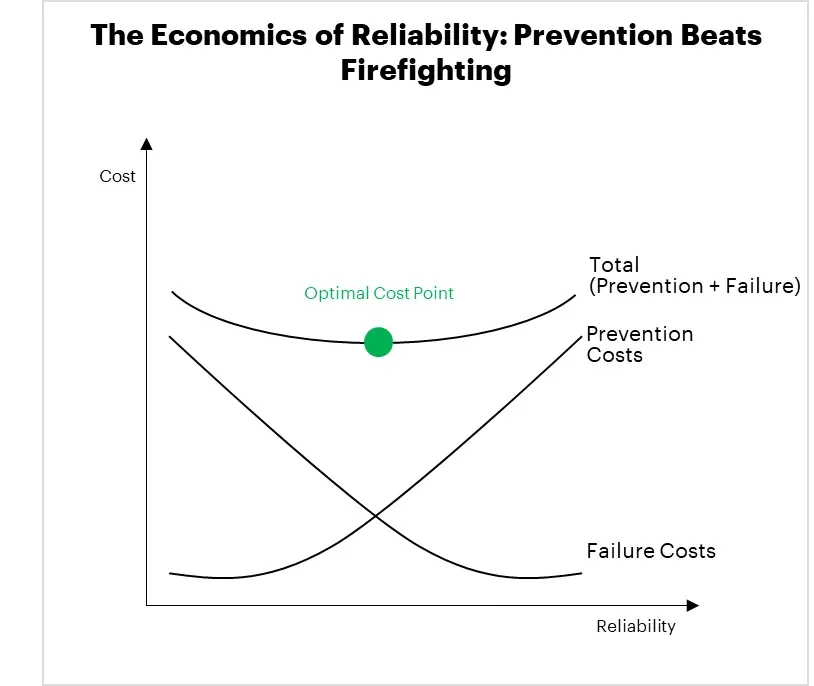
Figure 1: Reliability reduces total cost. prevention and automation become cheaper than failure.
The model: three curves
The Reliability–Cost Inversion Law is easiest to see as three curves:
1) Failure costs (reactive costs) slope downward with reliability
Fewer failures mean fewer incidents, less downtime, fewer emergency changes, and lower recovery cost.
2) Prevention costs (proactive costs) slope upwards, steeply at high reliability
Going from 99.99% → 99.999% often means redundancy, deeper testing, better engineering discipline, and more automation. Each additional “nine” can be dramatically more expensive.
3) Total cost = failure + prevention
That creates a U-shaped curve. The bottom of the “U” is the optimum reliability level, where total spend is minimized.
Most organizations misread the curve because they only measure downtime. But at enterprise scale, the biggest bill is often not the outage itself, it’s what the outage does to the organization.
The organization rarely compares failure budget and prevention budget objectively. Instead, it overinvests in incident remediation, because that pain is visible and urgent.
The hidden reliability tax
In Mastering Site Reliability Engineering in Enterprise, I compare modern delivery to driving on an autobahn: you don’t get to choose whether you go fast, markets and competitors force it. Reliability is the seatbelt and guardrails that let you move quickly without turning speed into chaos.
Without those guardrails, you pay a hidden reliability tax:
coordination overhead (war rooms, escalations, cross-team paging)
cognitive load (context switching between roadmap and emergencies)
operational debt (quick fixes that increase future fragility)
cultural damage (blame, reduced psychological safety, risk aversion)
This is why “reliability is expensive” becomes a self-fulfilling statement: the organization invests late, when failure costs are already compounding.
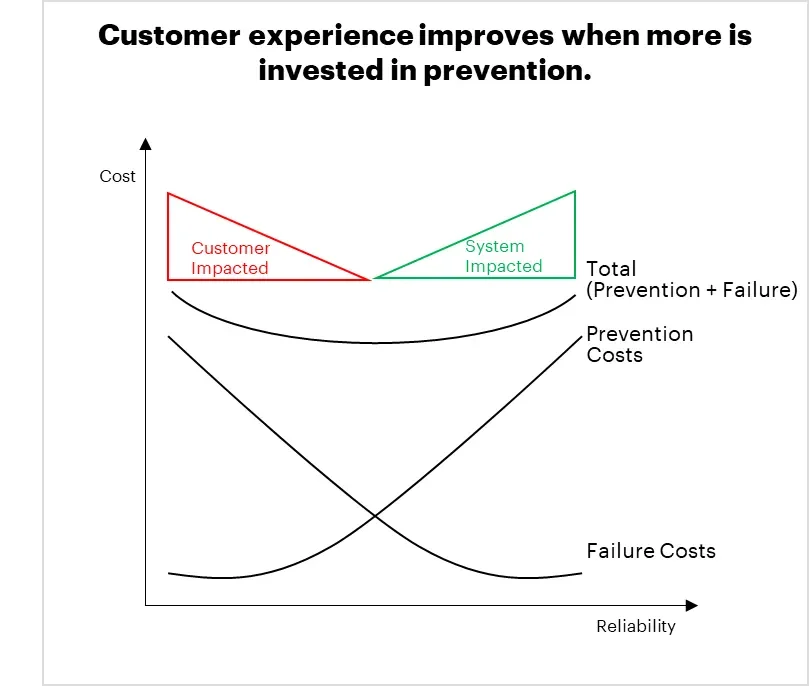
Figure 2: When costs are driven by failure remediation (incidents), the customer feels the pain directly; when you invest in prevention, the system absorbs the impact.
Failure costs and prevention costs hit customers differently
Failure Cost = Customer Pain
Customers experience every incident: broken journeys, delays, support calls, and the need to open tickets. In the worst case, they leave, or they build their own workarounds (shadow IT).
Prevention Cost = System Resilience
Prevention strengthens robustness and stability. Instead of customers looking for alternatives, you see improved trust, smoother journeys, and growth supported by a system that can scale.
How to bring it into action
You don’t start by chasing “five nines.” You start by turning reliability into a business control system:
Measure the real cost of failure
Include incident labor, recovery time, coordination overhead, and opportunity cost from delayed delivery.Pick a small number of SLOs tied to customer journeys
One or two SLOs per critical flow is enough to create focus and learning.Use error budgets to make decisions
Error budgets should influence release policy and feature prioritization, otherwise they become reporting theatre.Kill toil relentlessly
Toil reduction is the compounding lever: it funds reliability work, increases consistency, and frees capacity for prevention.
When you do this well, reliability stops being a cost center and becomes what it really is: the cheapest way to buy speed.
— — — — — — — — — — — — — — — — — — — — — — — — — — — — — — — — — — — — —
→ If you want a practical starting point, message me “INVERSION” and I’ll share a lightweight diagnostic to estimate your current position on the U-curve and where the optimum likely sits.
→ We explore these ideas in much more depth in our book, Mastering Site Reliability Engineering in Enterprise, a complete guide to building resilient, chaos-tolerant systems, available on Amazon and Springer.
Mastering Site Reliability Engineering in Enterprise now on amazon.com
Mastering Site Reliability Engineering in Enterprise on Springer